
Written in French Jan, 22 2014
Introduction
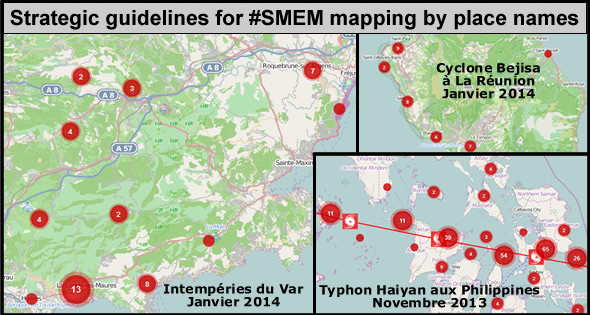
The overall approach which will be described here, has been defined and adopted on the course of emergency operations performed by VISOV (Volontaires internationaux en soutien opérationel virtuel meaning International Volunteers in Support to Virtual operations, a francophone team of volunteers active in SMEM) during the following emergency events:
– Typhoon Haiyan in the Philippines in November 2013
– Storm Dirk in metropolitan France in December 2013
– Cyclone Bejisa in La Réunion in January 2014
– The adverse weather conditions in the Var department (France) in January 2014
This approach has been briefly presented during the 6th SDIS* geographical information meetings in December 2013. The presentation can be viewed below:
The approach will be detailed in this blog in 3 articles:
A/ Strategic guidelines of mapping by place names in SMEM
B/ Geographical information searching techniques in SMEM
C/ 2.0 mapping tools for the display of SMEM search results
In order to disseminate this information to the largest audience possible, I will hopefully have time, enough to design a summarized graphic illustration at the end of the 3 articles.
A/ Strategic guidelines for SMEM mapping by place names
A lot of the geographical information which is useful for rescue operations and to the population in case of civil defense or humanitarian crises is available in social media. In this post, I intend to provide you with a quick overview of few approaches aiming at precisely pinpointing such information through GPS coordinates. This article, which is the first of a series of 3 articles, is focusing on a method designed to convey geographical information by place names mentioned in social media publications.
6 strategic guidelines will be explained below:
– Monitor the huge span of social media
– Perform spatial screening of SMEM searches on all the area involved
– For a start, aim for a reasonable coverage of the situation rather than an exhaustive view
– Organize teams of volunteers by geographical area and skills
– Emphasize areas involving major stakes
– Check the information and avoid potential errors
1/ Monitor the overall social media field
Do not limit search to a handful of social media, cover the overall field in the most comprehensive way possible in order to identify the sources which best cover your matters of concern. It is recommended to start with the most popular social media such as Facebook, Youtube, Twitter or Instagram and to continue with less popular media like wikis, local forums or other crowdsourcing maps that might be set up.
Such a good coverage of the social media field will allow you to:
– Increase opportunities to find useful information with regard to your areas of concern. In fact, it is inaccurate to believe that all useful information will be displayed on Twitter or Flick-R during an emergency situation. It is therefore necessary to keep an eye on the huge span of social media;
– Identify collaborative groups with interests closer to your areas of concern and likely to participate in your project;
For example, during Cyclone Bejisa, an online community spontaneously evolved in Facebook and shared images of the cyclone. Following this community was a mean to complement searches and also the map created by VISOV with images showing damage while displaying and sharing in return the information gathered from other sources. During Typhoon Haiyan, there were an outstanding number of Skype groups, mailing lists, and collaborative work papers used for the coordination of volunteer teams which disseminated useful information;
– Beside, there are cases where social media emerge amid a major civil defense crisis. It happened it Japan for example. After the major earthquake Sendaï (followed by a Tsunami and the Fukushima nuclear disaster), applications such as Line and Twitter gained a significant number of new subscriptions. In the same way, during the earthquake in Haïti, social media specializing in geographical information such as OpenStreetMap or Ushahidi also showed the essence of their activity in terms of crowdsourcing and information dissemination geared towards emergency organizations and the general population.
2/ Perform spatial screening of SMEM searches on all the area involved.
Relief operations or coordinated humanitarian aid should primarily focus on ensuring that no one in need of assistance is left behind. Implementation of searching activities must therefore cover all the area affected if applicable or the area you are monitoring. However, it is not unusual that traditional media cover only certain areas and information rendered in social media may often put more emphasis on an area than on another.
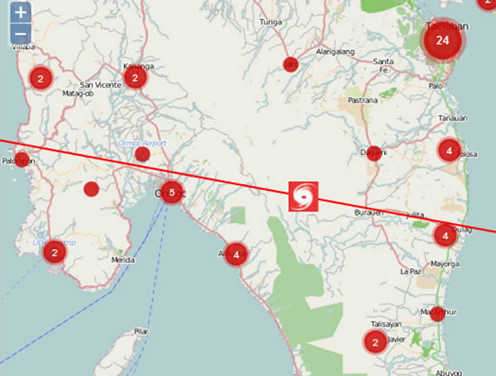
In the case of Typhoon Haiyan in the Philippines, social media delivered more information from the eastern part of the affected area. News coming from the western part or from isolated islands was more scarce and difficult to find. When after several hours of search, no information is found on certain areas, it is recommended to widen the scope of search further than social media by including any other media or online database as was done by VISOV while performing a study on isolated islands affected by Typhoon Hayian. In case of critical lack of information on specific areas (“white zones”**) the solution of last resort could be to send a highly prepared person or team in order to convey information from the field (GPS, Internet via radio or satellite, real time image display…). Moreover, still in the case of “white zones” or “dead angles”, a request may be sent through social media to people who are present in those areas. In such a situation, it is crucial at all times to avoid exposing those people to more danger and to respect their privacy.
Eventually, if a major hazard is foreseen, it is highly recommended to engage in early consultation of official hazard maps as applicable to the kind of hazard involved. In France for instance, maps such as those included in the PPR (Plans de Prévention des Risques meaning Hazard Preparedness Plans) are available on official websites of the Préfectures (local administrative authorities) and may be of help to determine the potential impact zone.
3/ For a start, aim for a reasonable coverage of the situation rather than an exhaustive view
With the tremendous amount of information that can be made available through social media in the event of a major disaster, especially in densely populated urban areas; data collection tasks can seem gigantic when you consider reporting on a map all the information at hand. In such cases, you should not aim to report all the information on a given area but you should rather provide adequate and good quality information to draw a fair picture of the situation according to the objectives of your operation.
Coming back to the Typhoon Haiyan in the Philippines, a considerable number of images of the disaster taken in the city of Tacloban were published. To ensure the most exhaustive screening possible of the affected area we were covering (all the area along the way of the Typhoon, from East to West across the Philippines), we decided not to report in our crowd map all the pictures available to us on that city. It is way more beneficial to display on the map the most significant information (impact on hotspots such as hospitals, areas affected by storm surge flows…) Another measure in this case of abundant material on a single spot could be to indicate links to accounts featuring the largest amount of information on that spot, like picture galleries with hundreds of images on Facebook or Flick-R.
Basically, when you have a small team of volunteers, the more extensive the available information is, the more thematic or geographically oriented your approach should be. On the contrary, if your community of volunteers is bigger, you can engage them in a wider span of operations, the ideal situation for any group of volunteers being to be able to bring together on a map, all the geographical information regarding the impact of the disaster and the response of organizations involved. Hence, it is important to keep in mind that it is smarter to cover a narrowed field appropriately than intending to embrace all topics at the risk of missing out important facts when looking at all the information issued in social media with regard to the situation.
4/ Organize teams of volunteers according to the area you are monitoring
As it has been pointed out several times when dealing with emergency mapping, it is common that collaborators convey similar or even identical geographical information at the same time and about the same area. This is why it is desirable to assign specific geographical areas to monitor within the team. In fact, this will also help outline more promptly an overall perspective of the situation on your crowd map. For example, if you are a team of two collaborators, one could be assigned research on the northern part of the area whereas the other one could be in charge of the southern part.
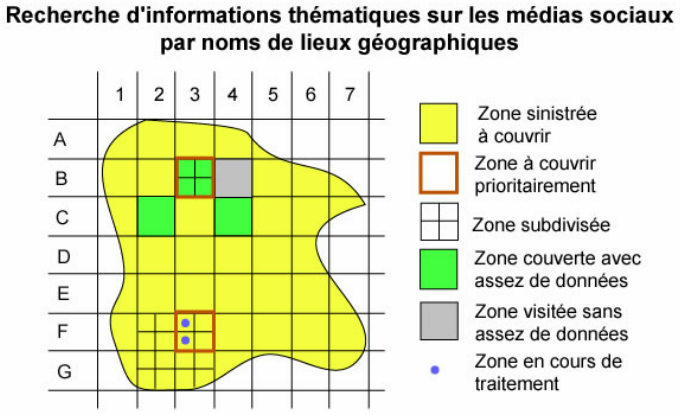
If you are lucky to be part of a larger group of volunteers, you may split the area to be covered into smaller sub-areas. This way, a volunteer who is available only for few hours could perform research on one of the sub-areas so far unattended in a more exhaustive way than if he had to convey information randomly while covering a wide impact zone. Another potential approach could be to define priority sub-areas (most impacted cities, domino effect prone areas…). Finally, administrators of collaborative maps should master at least two different platforms in case one of them faces any failure.
It could be useful to develop an interface allowing the distribution of the area to be monitored into sub-areas. Each volunteer could then decide to go to one of those sub-areas and indicate to the community of volunteers that he is going to take that sub-area in charge when searching information. As a consequence, the other volunteers can concentrate on other sub-areas more efficiently. For a hazard involving a regional impact, the grid defining sub-areas presented above, can be replaced with communal borders (French administrative boundaries available on OpenStreetMap). The most suitable application for this purpose is Hot Task Manager used by OpenStreetMap contributors. It has been developed in Python. All willful open source code developers are invited to contact VISOV and help adapt this tool to our SMEM mapping needs.
Do not hesitate to ask help from other communities. For instance, if you realize that basic geographical information is missing (on buildings, roads, infrastructure location…), chances are some OpenStreetMap community members are ready to help you find them or add them to your map background. To do so, you may post your request for assistance on one of OpenStreetMap’s mailing lists or on IRC chats. For your request to be granted, your collaborative map background must be open and editable like the one of OpenStreetMap.
During a humanitarian collaborative mapping operation covering Toliara following Cyclone Haruna in Madagascar, February 2013, we mobilized The OpenStreetMap community to create a reference map background which was further shared by NGOs in the form of physical maps used in the field. Whenever it is possible to call upon communities such as OpenStreetMap during an emergency situation, initiating interaction before any potential event is naturally highly desirable.
5/ Put emphasis on hotspots
Within the load of information you will go through when searching by place names, some pieces of information will be more important than others according to your area of interest. This information will be often related to hotspots or focus areas (major or vital places). In fact,
⦁ healthcare centers in a wider sense;
⦁ firefighter headquarters;
⦁ accommodation or response coordination centers;
⦁ priority transportation infrastructures, technical, harbor, airport and industrial networks;
⦁ schools, establishments servicing the public
⦁ etc.
will be of real interest and will deserve to be featured on your collaborative map. Such areas can fortunately be located precisely at cadastral level by comparison with formerly existing spatial data. Moreover, authorities, the media and now citizens, thanks to their civil drones, may release aerial photos of the affected area. If such tools are available to you, you may use them to visualize the extent of the affected area and identify the affected hotspots by comparing the perspective with a traditional map. As such important places should be precisely reported on a map, it is highly recommended to entrust experienced members with this task. To speed up the process, it is strongly advised that authorities allow partial or total access to those areas (vital hotspots, aerial photos) so as to help volunteer teams but also State officers save up the time they would be spending collecting pieces of information one by one.
However, beware not to directly report exact GPS coordinates based on copyright data from map backgrounds of private organizations (Google, IGN, NavQuest, Waze….) if you are not exclusively working on one of their collaborative platforms. In fact, if you are working on a crowd map by Ushahidi using a map background by OpenStreetMap, reporting the GPS coordinates of a hotspot such as a SEVESO plant*** found on Google Map would be illegal as the use of such information is restricted by Google. In the same way, if you work on a crowd map by Google, the GPS location of a given spot identified on an IGN map cannot be imported to your map. However, you may at any time and on any kind of platform and for any purpose, use data from OpenStreetMap, the “sole” condition being to mention on your map “OpenStrretMap contributors”. This is one of the reasons why we strongly recommend that you issue your geographical emergency information on OpenStreetMap: it is available to a larger audience, there are no copyright related restrictions and it is totally legal.
6/ Check the information and prevent potential errors
There are two types of risks of forwarding errors in SMEM mapping: inaccurate geographical information is published in one of the social media screened or inaccurate report of geographical information is issued on a crowd map.
In the first case, the publication of inaccurate information may be intentional or rather inadvertent. To avoid such a situation, it is important to check the quality of publications made by the author, by verifying his profile and his publications (Is the author present on the affected area? Is he accustomed to publishing sensational content? Is the content outstanding? Is he at the source of the event?…) There are also tools that can help identify part of this erroneous information.
On another hand, a person may publish spatial information with geographic coordinates different from the ones of his actual location. There could be various explanations: lack of precision/error of the GPS terminal, absence of internet where the person is located, and willingness to draw attention on that location…).
Location errors may happen during the reporting process of geographical information on a collaborative map, even if reliable information was displayed in the original publication from the source media. For instance, on the official Google Crisis Map dedicated to Cyclone Phailin in October 2013, several hospitals were located far from their actual position during many days, up until we notified it to managers of Google.org in the Skype chat dedicated to the disaster.
Furthermore, if you call upon contributors who do not have a good command of your tool, you are most likely to face site location problems, redundancy in reports, omitted source links…As a consequence, when developing any collaborative map, it is preferable that the verification of quality and accuracy of reported information is taken care of by one of your team members. If you count many greenhorns at crowdmapping among your team, you had better coordinate their search results on a spreadsheet or a small online application with simplified sections where they may report their search results (more details in the forthcoming second article).
If you are performing remote operations or have only few volunteers in the field, in most cases, it will be difficult to thoroughly check the information. Consequently, it is advised to issue a warning notice regarding the validity of published information, even if the geographical information comes from the authorities or the press. VISOV almost always rates publications on its collaborative maps as not verified. Even among professionals, errors may occur as we have already pointed out. Therefore, persons in charge of reading the maps should be invited to check themselves the information we provide them.
For the sake of your volunteers’ legal safety, names and surnames should not be mentioned on publications so as to avoid any potential legal threat resulting from the publication of erroneous information. This is not a precaution meant to help you hide from justice but rather to be safe from blackmailing (I have never witnessed such a situation but it should not be excluded).
For instance, I never mention my name as contributor when editing a report on an emergency collaborative map (even if I do so more in a collective spirit than for legal reasons). Finally, in order to better coordinate your response with other team members, you may use a pseudonym when publishing on crowd maps. Some NGOs more formalized than VISOV at legal and financial level, provide specific insurance to their employees and volunteers although they refrain from mentioning it.
Whatever the situation may be, it is better to define user terms and conditions for your map in a specific section and to clearly state that you do not take any responsibility in guaranteeing the accuracy of the information reported. Make also sure to notify that only publically released data is analyzed and that any individual has the right to remove data relating to him. We intend to work on these legal aspects, which we do not consider as a priority during emergency situations, but they should be preferably dealt with upstream.
Conclusion
Regardless of the type of research techniques or collaborative mapping tools, these guidelines help us monitor our projects and teams in all circumstances. In the second part of this series of 3 articles dedicated to SMEM mapping by place names, we will analyze searching techniques and methods of geographical information verification.
* County Accident Response Services
** Areas where little or no information is available
*** Production plants subject to technological hazard
[…] to what could replace OCHA’s failed hashtags in West Africa, Cédric Moro’s Guidelines for Mapping by Place Name published in January 2014 would be a good start. Please post others in the […]